The current URL is datacrystal.tcrf.net.
Blaze Union/Tutorials: Difference between revisions
mNo edit summary |
No edit summary |
||
| Line 56: | Line 56: | ||
That concludes this tutorial. I hope you enjoyed it. Please feel free to edit this tutorial to provide clarifications or use the talk page for feedback. Thanks, flame | That concludes this tutorial. I hope you enjoyed it. Please feel free to edit this tutorial to provide clarifications or use the talk page for feedback. Thanks, flame | ||
==PPSSPP GE Debugger Tutorial== | |||
This tutorial will explain basic functions of the GE debugger that is built in to PPSSPP. It is useful when researching graphics-related modifications, for example, anything related to font display or texture size mods. | |||
=GE Debugger Basic Operation= | |||
Get to this scene again: | |||
[[File:BU_1.jpg]] | |||
With emulation running, push CTRL+G to open GE debugger. The window appears blank at first. Please click the "Step Frame" button on the upper left of the window. You should see this: | |||
[[File:PPSSPP_debug_03.png]] | |||
Explaining GE debugger. | |||
In the top left is the currently loaded texture. The address and size of the texture in pixels is displayed below. | |||
To the right of the texture is the frame. During GE debugger operation, it will show the frame as it's in progress being drawn and one other thing I'll get to later in this tutorial. | |||
On the bottom is the display list window. It has tabs for various functions and I don't know what they all do. Keep in mind I do not know how 3D graphics work. The "Texture" tab has information about the currently loaded texture. | |||
Now explaining the debugger controls. | |||
"Step Frame" which we pushed earlier. A bit about how PSP graphics work. It is the job of the CPU to prepare instructions for the GPU to execute. It does this using routines in the game's program. At some point the CPU will be ready for the GPU to start working on drawing the frame and will kick it off with system calls (syscalls for short). All of the GE-related system calls start with "sceGe," sceGeDrawSync is the one that kicks off the GPU. It will stop when it gets to the return command in its program. The prepared frame is always pushed to the display whenever it's time (display refreshes). Now back to "Step Frame." It halts GPU execution just before it executes the first instruction in its program after a frame refresh. | |||
"Step Tex" executes until the next texture is loaded. | |||
"Step Draw" executes until after the next draw instruction. | |||
"Step Prim" executes up to the next draw instruction. | |||
"Step Into" executes single instructions in the display list. | |||
=Finding and Modifying Textures= | |||
Let's look at modifying a texture manually at run time. Click "Step Tex" until you get to the English font texture, which is 15 times (after the start of the frame draw). To go faster, click "Step Tex" once, then hold down the enter key to rapidly step through them. | |||
Now click "Step Prim" until you see the stencil in the image below. Please make a note of this because we will need it for the next part of this tutorial. | |||
In the texture window, you see the texture stencil. In the frame window, you see the frame stencil. Those frame stencils overlap left-to-right a bit which is why it looks that way. | |||
[[File:PPSSPP_debug_04.png]] | |||
For this tutorial, what we really need to make a note of is that the texture address is 0x09990210. You don't need the zero on the front, 0x9990210 will also work. We also need to know how big the texture is. If you click the texture tab you see the format is CLUT4 (color look up table 4 bits per pixel) so the size is 512 * 512 * 0.5 or 0x2000 (8 kb). | |||
We just want to see some kind of effect in game. Open the CPU debugger. Click in the memory view window at the bottom. Press CTRL+G and paste in the address 0x9990210. Click in the hex view on the left and type about 8 rows (0x80) worth of FF bytes. Then click step frame. You will see that the texture for the commas was altered. | |||
[[File:PPSSPP_debug_05.png]] | |||
This texture is a tiled image (PPSSPP calls it swizzled; GE wants a tiled image for fast draw speeds so on PSP this is called swizzled). The pixels are stored in a specific order but not linear by rows like a PNG or JPG image would be. So don't be scared if the modifications on here don't make sense. | |||
Why is this useful? If we know where decompressed texture data is, we can dump it. You can also dump the color table; the address and format of the color table can be found in the texture tab under CLUT. With both of these we can covert the texture into an image file. But the most useful thing is, we can search for that pixel data and find where in the ROM the image that we're looking for is. | |||
=Intro to Display List= | |||
Refer to the screenshot of GE debugger from before: | |||
[[File:PPSSPP_debug_04.png]] | |||
A vertex in graphics refers to X and Y coordinates, also Z if you are talking about 3D graphics. Vertices is the plural. | |||
What is going on here? DRAW PRIM RECTANGLES. The CPU is telling the GPU that a rectangle draw has been prepared. There are sixteen vertices: sixteen sets of x and y coordinates. So eight rectangle draws. The vaddr or vertex address is 0x08aedd50 (your value might be different because of how this game allocates memory). | |||
Another thing to be aware of is the vertex type. Do you see a few lines above the draw where it says "SetVertexType"? It says u16 texcoords (texture coordinates), s16 positions. Texture coordinates specify texture stencil positions. "Positions" refer the position of the frame texture stencil. | |||
Armed with this knowledge, and without unpausing, we can go to the CPU debugger and inspect this area of memory to see what the vertex data looks like in memory. | |||
[[File:PPSSPP_debug_06.png]] | |||
For this vertex format, each vertex is 0x10. The first pair is drawing the letter を. We see that: texture stencil: x-position: 0x64 to 0x78 (100 to 120), y-position 0x8C to 0xA0 (140 to 160). The origin is the top-left, so six rows across and eight rows down. We see that を is highlighted in the stencil at this position. Frame positions work similarly. Frame stencil: x-position: 0x64 to 0x78 (100 to 120), y-position 0xC6 to 0xDA (198 to 218). So the top-left of the stencil should be 100 across, 198 down, and this is what we see in GE debugger. Incidentally, the PSP frame size is 480 x 272. | |||
{{Internal Data|game=Blaze Union}} | {{Internal Data|game=Blaze Union}} | ||
Revision as of 13:56, 26 May 2019
The following article is a Tutorial for Blaze Union.
ASM Tutorial Using PPSSPP
By flame
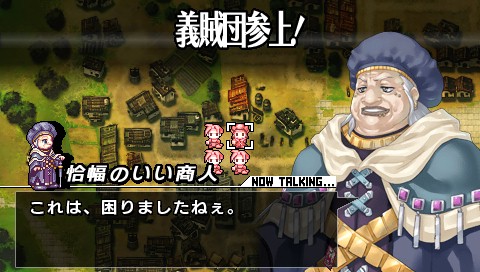
Get to this scene:
Save the state. In PPSSPP, F3 cycles through five save states and F2 saves the state. F4 is used to load the state.
Reference the RAM map for this game. You can find it where it says "internal data" at the bottom of this page; the same applies for other games on Data Crystal.
For this tutorial, we are interested in narrowing the font width. From the RAM map for this game, we see that 0x088A3858 is loading the x-spacing value. We're going to make it a lot narrower.
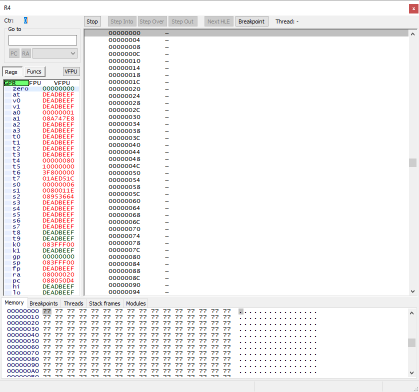
Open the debugger by pressing CTRL+D. Note that you can open the debugger with emulation paused too, if you want. Don't get too scared just yet.
Explaining the debug window. First the main parts.
On the left are registers. We can talk more about registers if you want in another tutorial. A register holds a value that is ready to be used by an instruction. In RISC like the PSP's R3000, values have to be in a register to be used by the program.
To the right of the registers is the program window. It shows a disassembly of the program.
On the bottom is the memory view window, and it has some tabs with other functions that we'll get to in another tutorial.
Now more advanced stuff.
If you click funcs above the register window, it will display a list of detected functions from the disassembly. You can double-click any function to jump the program window to the start of that function. Try that now (pick a random function).
Above the program window are function buttons that say stop/step into/step over/step out/next HLE, breakpoint. Stop stops emulation. When you click it, it will change to "Go" and click this will restart emulation. "Step into" steps through the program one instruction at a time. "Step over" is similar to "Step into" but for functions, instead of stepping into a function, it will execute the function and leave you where that function returns. "Step out" executes the program until the next return. I don't know what "Next HLE" does. "Set breakpoint" will mark a place in the program. Each time the program arrives at a breakpoint it will stop execution similar to pushing the "Stop" button.
Please go ahead and hit the "Stop" button now.
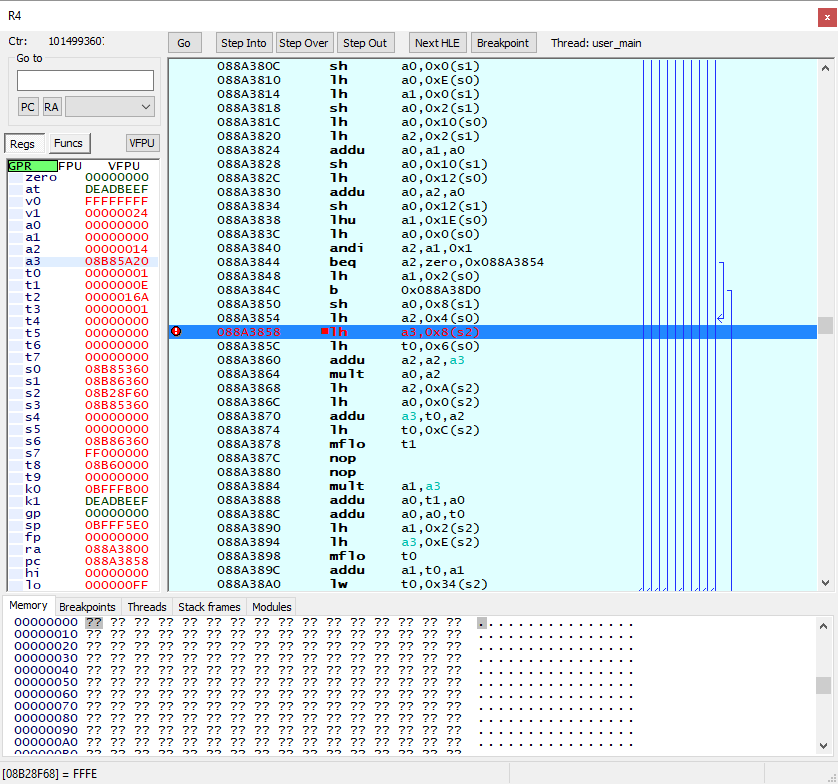
Now we need to go to the place in the program where it is loading x-width. Click on any instruction in the program window. Now push CTRL+G and copy and paste the address: 0x088A3858 and push enter. You will see that the instruction at the specified address has been jumped to and highlighted. Double-click on it to set a break point. Now click run.
You see that the execution is continuing without hitting our break point. This means that our break point is not being hit. That is, that instruction is not being executed during the current game loop.
Pick up the controller and advance the dialog by pushing O. You will see the execution halt.
Do you see the [08B28F68] = FFFE at the bottom? This is a lh "load halfword" instruction. It says to load the half word at the address in register s2 plus an offset of 0x8 and place the contents in register a3. Just as a side note the "a" registers a0, a1, a2 and a3 are often used by compilers for passing function arguments. Back to the tutorial. 0xFFFE corresponds to a value of negative 2.
We did not actually need to do anything there though, clear the break point by double-clicking it. Then click in the PPSSPP emulation window and press F4 to load the state you saved earlier.
Now we need to get ready to modify the program. Halt emulation by pushing the "Stop" button, then navigate to the key address by pressing CTRL+G and copy and paste the address: 0x088A3858. Now we need to modify the program. Right-click the highlighted instruction, then select "Assemble opcode." We are going to write our own assembly instruction on top of this one to modify the program. The instruction we want is li a3, -10. li is load immediate. Immediate means a value that we, the programmer, specify (i.e., not a value in memory). Load means we are going to place the value in a register. In the box, enter li a3, -10. I need to refer you to the MIPS manual for opcode formatting, but a space always goes after the opcode. A comma goes between all operands that are not offsets. The two operands for the li instruction are the target register and the value we want to load.
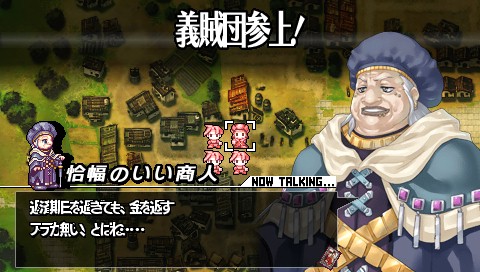
Now that we're done modifying the program, we need to now run it and observe the effect on the game. As we saw before, this instruction does not get hit when text is on the screen; it only gets hit when displaying new text. Click run, then push O on your controller to advance the dialogue to observe the results. All the characters on top of each other!
I don't want to conclude the tutorial just yet. If you like this, you can select a new save slot with F3 and then save the state. You can then restore the program to how it was earlier using F3 to select the previous state and then F4 to load. Advance the dialogue with O and observe how your changes have been undone. It's always a good idea to save your state when making changes because crashes will result from assembly code errors.
That concludes this tutorial. I hope you enjoyed it. Please feel free to edit this tutorial to provide clarifications or use the talk page for feedback. Thanks, flame
PPSSPP GE Debugger Tutorial
This tutorial will explain basic functions of the GE debugger that is built in to PPSSPP. It is useful when researching graphics-related modifications, for example, anything related to font display or texture size mods.
GE Debugger Basic Operation
Get to this scene again:
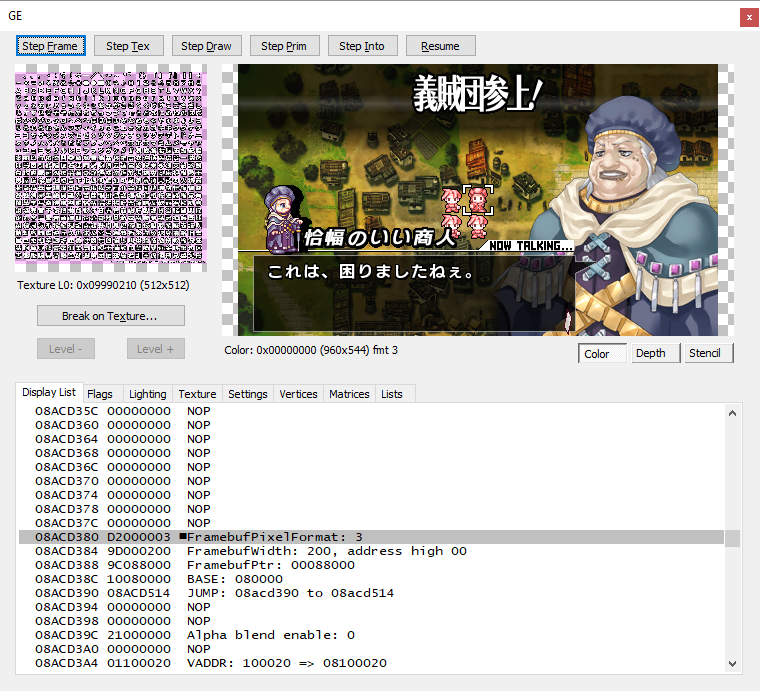
With emulation running, push CTRL+G to open GE debugger. The window appears blank at first. Please click the "Step Frame" button on the upper left of the window. You should see this:
Explaining GE debugger.
In the top left is the currently loaded texture. The address and size of the texture in pixels is displayed below.
To the right of the texture is the frame. During GE debugger operation, it will show the frame as it's in progress being drawn and one other thing I'll get to later in this tutorial.
On the bottom is the display list window. It has tabs for various functions and I don't know what they all do. Keep in mind I do not know how 3D graphics work. The "Texture" tab has information about the currently loaded texture.
Now explaining the debugger controls.
"Step Frame" which we pushed earlier. A bit about how PSP graphics work. It is the job of the CPU to prepare instructions for the GPU to execute. It does this using routines in the game's program. At some point the CPU will be ready for the GPU to start working on drawing the frame and will kick it off with system calls (syscalls for short). All of the GE-related system calls start with "sceGe," sceGeDrawSync is the one that kicks off the GPU. It will stop when it gets to the return command in its program. The prepared frame is always pushed to the display whenever it's time (display refreshes). Now back to "Step Frame." It halts GPU execution just before it executes the first instruction in its program after a frame refresh.
"Step Tex" executes until the next texture is loaded.
"Step Draw" executes until after the next draw instruction.
"Step Prim" executes up to the next draw instruction.
"Step Into" executes single instructions in the display list.
Finding and Modifying Textures
Let's look at modifying a texture manually at run time. Click "Step Tex" until you get to the English font texture, which is 15 times (after the start of the frame draw). To go faster, click "Step Tex" once, then hold down the enter key to rapidly step through them.
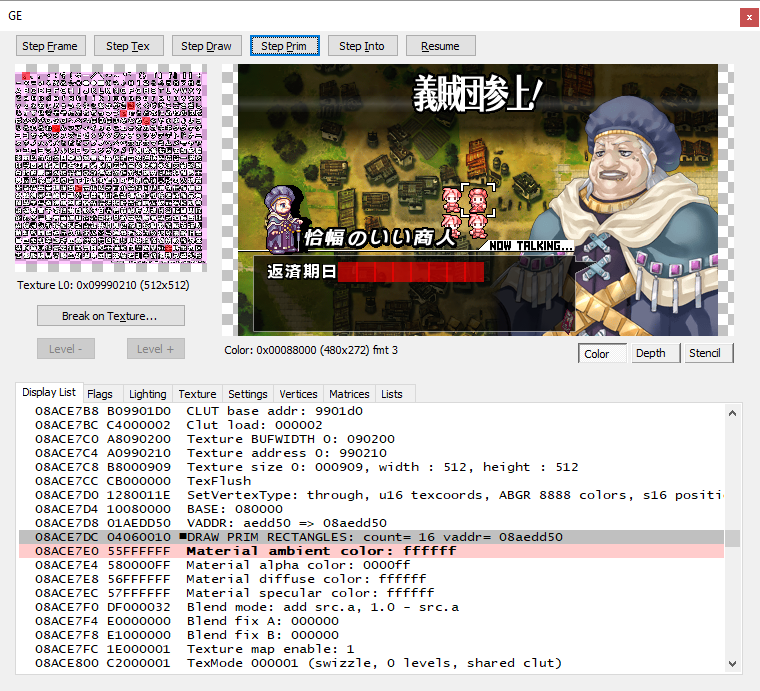
Now click "Step Prim" until you see the stencil in the image below. Please make a note of this because we will need it for the next part of this tutorial.
In the texture window, you see the texture stencil. In the frame window, you see the frame stencil. Those frame stencils overlap left-to-right a bit which is why it looks that way.
For this tutorial, what we really need to make a note of is that the texture address is 0x09990210. You don't need the zero on the front, 0x9990210 will also work. We also need to know how big the texture is. If you click the texture tab you see the format is CLUT4 (color look up table 4 bits per pixel) so the size is 512 * 512 * 0.5 or 0x2000 (8 kb).
We just want to see some kind of effect in game. Open the CPU debugger. Click in the memory view window at the bottom. Press CTRL+G and paste in the address 0x9990210. Click in the hex view on the left and type about 8 rows (0x80) worth of FF bytes. Then click step frame. You will see that the texture for the commas was altered.
This texture is a tiled image (PPSSPP calls it swizzled; GE wants a tiled image for fast draw speeds so on PSP this is called swizzled). The pixels are stored in a specific order but not linear by rows like a PNG or JPG image would be. So don't be scared if the modifications on here don't make sense.
Why is this useful? If we know where decompressed texture data is, we can dump it. You can also dump the color table; the address and format of the color table can be found in the texture tab under CLUT. With both of these we can covert the texture into an image file. But the most useful thing is, we can search for that pixel data and find where in the ROM the image that we're looking for is.
Intro to Display List
Refer to the screenshot of GE debugger from before:
A vertex in graphics refers to X and Y coordinates, also Z if you are talking about 3D graphics. Vertices is the plural.
What is going on here? DRAW PRIM RECTANGLES. The CPU is telling the GPU that a rectangle draw has been prepared. There are sixteen vertices: sixteen sets of x and y coordinates. So eight rectangle draws. The vaddr or vertex address is 0x08aedd50 (your value might be different because of how this game allocates memory).
Another thing to be aware of is the vertex type. Do you see a few lines above the draw where it says "SetVertexType"? It says u16 texcoords (texture coordinates), s16 positions. Texture coordinates specify texture stencil positions. "Positions" refer the position of the frame texture stencil.
Armed with this knowledge, and without unpausing, we can go to the CPU debugger and inspect this area of memory to see what the vertex data looks like in memory.
For this vertex format, each vertex is 0x10. The first pair is drawing the letter を. We see that: texture stencil: x-position: 0x64 to 0x78 (100 to 120), y-position 0x8C to 0xA0 (140 to 160). The origin is the top-left, so six rows across and eight rows down. We see that を is highlighted in the stencil at this position. Frame positions work similarly. Frame stencil: x-position: 0x64 to 0x78 (100 to 120), y-position 0xC6 to 0xDA (198 to 218). So the top-left of the stencil should be 100 across, 198 down, and this is what we see in GE debugger. Incidentally, the PSP frame size is 480 x 272.
Internal Data for Blaze Union
| |
|---|---|
